
How to Compare Budget Travel Sites: Strategic Analysis & Architecture
Modern consumer travel booking operates within an extraordinarily fragmented digital infrastructure. What presents on a smartphone screen as an effortless search query to locate cheap airfare or overnight lodging is, in truth, an asynchronous request routed across legacy Global Distribution Systems (GDS), closed wholesale inventory databases, regional aggregators, and real-time yield-management algorithms. As consumer-facing platforms proliferate, ranging from metasearch engines and mainstream online travel agencies (OTAs) to obscure ticket consolidators, evaluating these digital gateways requires moving far beyond superficial consumer advice like clearing browser cookies or booking on a Tuesday at midnight.
To systematically analyze the market when users compare budget travel sites, one must first recognize that these platforms do not function as neutral public archives. They are commercial intermediaries operating under conflicting monetization models, variable inventory access contracts, and distinct revenue-sharing incentives. A display engine prioritizes search returns based on a complex matrix balancing consumer relevance against merchant commission yields, pay-per-click bidding structures, or wholesale markups. Consequently, the lowest headline rate shown on a discovery page rarely translates into the net lowest cost of travel once unbundled baggage fees, seat assignment surcharges, payment processing markups, and customer support limitations are factored into the transaction.
Evaluating these platforms requires an analytical, structural framework. Travelers, corporate travel managers, and digital strategists must understand how data feeds move from airlines and hotel properties into consumer aggregators, how database caching introduces price volatility at checkout, and how legal liability shifts the moment an intermediary processes a reservation. Without understanding these underlying mechanics, consumers routinely fall victim to price-drip mechanics, unbundled fare tiers, and non-refundable ticket terms that eliminate flexibility during travel disruptions.
This guide provides an exhaustive, editorial analysis of the contemporary travel distribution system. By deconstructing operational mechanics, risk profiles, total-cost calculations, and decision models, this document serves as a reference for readers seeking true financial efficiency without compromising consumer protections or travel reliability.
Understanding “compare budget travel sites.”
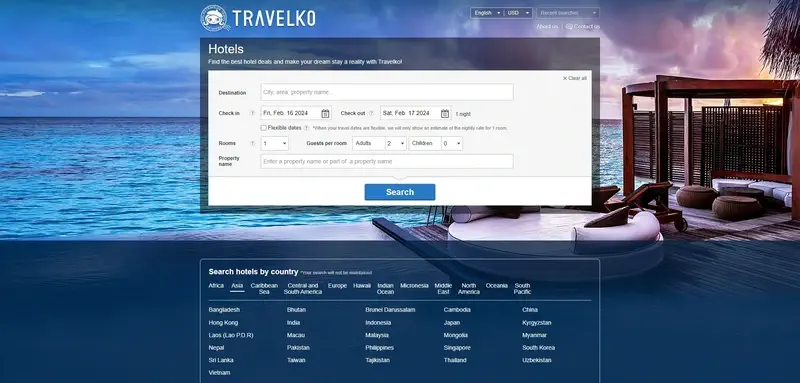
When consumers attempt to compare budget travel sites, they frequently operate under the assumption that all search portals perform identical data queries across the same global pool of inventory. This assumption misunderstands the architecture of consumer travel distribution. The digital travel marketplace is split into two primary operational models: Metasearch Engines and Online Travel Agencies (OTAs).
Metasearch platforms function purely as data aggregators. They query external databases to pull pricing and schedule information across hundreds of airlines, OTAs, and hotel networks, monetizing their operations through cost-per-click (CPC) advertising or affiliate referral models. Metasearch tools do not hold merchant accounts, issue passenger tickets, manage room reservations, or maintain frontline customer support channels. Conversely, OTAs operate as merchant resellers or agency brokers. They execute transactions directly with the consumer, collect payments, issue ticketing documentation, and retain legal responsibility for basic post-booking customer service.
Recognizing this architectural division is essential because price discrepancies between platforms stem directly from these structural differences. A metasearch engine might display an extraordinarily low base fare supplied by an obscure, secondary regional OTA. However, that regional OTA often recoups its narrow margin by imposing non-refundable change surcharges, charging administrative fees for basic seat assignments, or levying heavy phone support tariffs during schedule changes. In contrast, a tier-1 global OTA or direct carrier portal may list a slightly higher upfront base fare that includes standard consumer protection mechanisms, consolidated booking management, and integrated disruption assistance.
A secondary misunderstanding in travel comparison is conflating the initial search result rate with final settlement costs. Real-time inventory caching creates significant friction across discovery channels. To optimize system performance and reduce costly API query calls to GDS networks, comparison engines frequently display cached rate snapshots. These cached figures are updated only when a user selects a specific itinerary segment to move into the booking funnel. As a result, the rate shown on an initial results page can alter substantially upon reaching the final payment screen, a phenomenon known in the distribution sector as “price jump” or “rate drift.” Accurate platform evaluation requires calculating total cost of ownership across the full lifecycle of a trip rather than relying on initial search summaries.
Deep Contextual Background
The contemporary travel comparison ecosystem is the product of three decades of technological evolution, regulatory shifts, and corporate consolidation. To understand present-day market behavior, one must trace the transition from closed distribution networks to algorithmically driven dynamic pricing environments.
In the mid-20th century, airline reservations were processed manually through regional carrier desks. The creation of automated Global Distribution Systems (GDS)—most notably Sabre, Amadeus, and Travelport—in the 1960s and 1970s transformed the industry. These centralized systems allowed traditional brick-and-mortar travel agents to query airline seats, hotel rooms, and rental car fleets through standardized green-screen terminals. The GDS held absolute control over travel distribution, operating as an oligopoly that charged heavy segment fees to airlines and hotel chains for every booking completed.
The rise of the commercial internet in the mid-1990s democratized access to these GDS feeds. First-generation OTAs provided consumers with direct digital access to travel inventory, bypassing human travel agents. However, as hundreds of independent booking websites emerged throughout the early 2000s, consumer search behavior became fragmented. A traveler seeking the lowest rate had to visit dozens of different websites manually. This friction created the opportunity for metasearch engines, which introduced crawler software to scrape data from multiple OTAs and direct carrier sites, presenting unified pricing lists within a single interface.
Over the past decade, two macro-structural shifts have reshaped this market:
-
Market Consolidation: What appears to be a vast landscape of competing comparison engines is largely an illusion of choice. A vast majority of consumer-facing booking platforms and metasearch tools belong to a small group of publicly traded conglomerates. These parent holding companies manage diverse portfolios containing consumer-facing discovery tools, high-margin OTAs, specialized wholesale portals, and corporate travel software. This structural integration allows holding companies to route traffic internally between their own metasearch search engines and proprietary OTAs to maximize yield.
-
Shift to New Distribution Capability (NDC): Major airlines have increasingly bypassed legacy GDS architecture by adopting NDC XML-based technical standards. NDC enables carriers to break away from rigid, pre-defined fare classes and stream dynamic, real-time pricing directly to distributors. Under NDC, an airline can unbundle basic features, create personalized fare offers based on a passenger’s loyalty status or origin, and impose surcharges on legacy GDS bookings. Consequently, comparing travel sites no longer involves reviewing identical static inventory; it requires evaluating personalized, dynamically generated fare packages that vary across channels.
Conceptual Frameworks and Mental Models
To systematically evaluate budget travel engines beyond superficial price metrics, analysts and travelers can apply three distinct analytical models:
1. Full-Funnel Total Cost of Ownership (TCO) Model
This framework views travel expenditure as a multi-tier financial equation rather than a single checkout total:
$$\text{TCO} = \text{Base Inventory Rate} + \text{Mandatory Surcharges} + \text{Ancillary Additions} + \text{Operational Risk Premium}$$
-
Base Inventory Rate: The raw transport or lodging cost quoted on the discovery landing page.
-
Mandatory Surcharges: Destination facility charges, resort/facility fees, government security taxes, and merchant payment processing fees.
-
Ancillary Additions: Carry-on or checked luggage allowances, advance seat selection, basic flight flexibility options, and Wi-Fi access.
-
Operational Risk Premium: The calculated cost of lost time, unmanaged cancellations, and out-of-pocket replacement expenses incurred when booking through low-tier intermediaries with restrictive change terms.
Framework Limits: Quantifying the subjective value of lost time or customer support delays during a canceled connection remains inherently difficult.
2. The Intermediary Distance & Agency Spectrum
This model categorizes travel sites based on the degree of legal and technical distance they create between the consumer and the end service supplier (airline, hotel property, or car rental agency).
-
Direct Supplier Portal (Lowest Intermediary Distance): Reservations booked directly via carrier or property engines. The customer holds a direct contract with the service provider, ensuring full access to loyalty status perks, direct rebooking tools, and priority handling during irregular operations.
-
Tier-1 Global OTA (Moderate Intermediary Distance): Established global platforms with direct GDS or NDC integrations. While an intermediary exists, ticketing records are issued instantly, and standardized customer support systems handle basic itinerary modifications.
-
Secondary/Regional OTA (High Intermediary Distance): Small-scale digital brokers sourcing inventory through secondary consolidators or wholesale rate buckets. Change fees are high, customer service is frequently outsourced or automated, and modifications require triaging between the broker, consolidator, and operating carrier.
-
Split-Ticket Generator (Maximum Intermediary Distance): Aggregators that construct custom itineraries by linking two unpartnered low-cost airlines on separate tickets. The traveler holds two independent contracts, meaning a delay on the first flight voids the second flight without default carrier protection.
Framework Limits: Assumes direct suppliers always provide superior operational service, which may not hold during massive weather events or labor actions where all support channels become overwhelmed.
3. The Expected Value Disruption Matrix
This decision model evaluates whether booking a cheaper, more restrictive third-party fare yields a positive expected value when accounting for potential travel disruption:
$$\text{Expected Value (EV)} = S – (P_{\text{disruption}} \times C_{\text{recovery}})$$
Where $S$ represents upfront price savings, $P_{\text{disruption}}$ represents the historical probability of delay or cancellation on a given route/carrier, and $C_{\text{recovery}}$ represents out-of-pocket costs required to rebook transport on short notice.
Framework Limits: Estimating $P_{\text{disruption}}$ accurately requires access to historical carrier performance data, seasonal weather trends, and air traffic control delay records.
Key Categories or Variations
Navigating the budget travel market requires evaluating the operational mechanics, business models, and trade-offs inherent across six primary platform categories.
1. Metasearch Aggregators
Platforms like Google Flights, Skyscanner, and Kayak function as wide-net discovery engines that index fares across hundreds of external providers.
-
Business Mechanics: Monetized primarily through pay-per-click advertising, affiliate referral links, and sponsored display positioning.
-
Operational Trade-offs: Delivers maximum market visibility and flexible filtering options, but yields no direct control over booking fulfillment, exposes users to unvetted third-party brokers, and presents occasional price drift during checkout redirection.
2. Tier-1 Global OTAs
Networks like Expedia, Booking.com, and Trip.com handle end-to-end travel reservations directly for consumers.
-
Business Mechanics: Operates on merchant models (purchasing wholesale inventory and applying margin spreads) and agency models (collecting vendor commissions).
-
Operational Trade-offs: Provides unified trip management dashboards, consolidated booking capabilities, and standardized customer service routing, balanced against higher baseline fares compared to obscure discount portals.
3. Opaque Sellers and Last-Minute Liquidators
Platforms specializing in distressed inventory liquidation, opaque room bookings (e.g., Hotwire, Priceline Express Deals), or bulk consolidation airfares.
-
Business Mechanics: Protects public hotel and airline retail pricing by concealing property names or exact flight schedules until non-refundable payment settlement occurs.
-
Operational Trade-offs: Offers deep upfront savings (often 20% to 50% below public retail rates), balanced against strictly non-refundable terms, total lack of itinerary customization, and zero loyalty status credit.
4. Direct Supplier Channels
Official booking tools operated directly by airlines, hotel chains, and passenger rail systems.
-
Business Mechanics: Eliminates third-party acquisition costs, allowing suppliers to capture full margin value while establishing direct customer relationships.
-
Operational Trade-offs: Grants priority status for upgrades, complimentary schedule modifications, and direct support during irregular operations, but lacks cross-brand price comparison capabilities.
5. Algorithmic Split-Ticketing Search Engines
Specialized booking engines (e.g., Kiwi.com, Skiplagged) using custom algorithms to construct non-standard routes, such as self-transfer flight connections or hidden-city ticketing itineraries.
-
Business Mechanics: Generates revenue through platform booking fees, proprietary self-transfer insurance products, and ancillary markups.
-
Operational Trade-offs: Unlocks low-cost, multi-carrier routes that conventional search tools ignore, balanced against severe operational risks during missed connections, lost baggage liability, and potential carrier terms-of-service violations.
6. Closed-Loop and Wholesale Membership Portals
Private booking engines accessible exclusively through wholesale shopping clubs, corporate benefits portals, or premium credit card ecosystems.
-
Business Mechanics: Cross-subsidized by annual membership dues or credit card interchange fees, allowing portals to display negotiated, non-public wholesale rates.
-
Operational Trade-offs: Provides access to deeply discounted rates, integrated travel credits, and dedicated phone support lines, balanced against annual fee barriers and closed booking ecosystems.
Platform Architecture Structural Matrix
| Platform Category | Primary Revenue Driver | Price Transparency | Post-Booking Support Quality | Disruption Protection | Ideal Use Case |
| Metasearch | Cost-Per-Click (CPC) / Referral | High (Shows multiple sources) | None (Transfers to merchant) | None (Relies on vendor terms) | Initial fare research and route mapping |
| Tier-1 OTAs | Commission & Merchant Markup | Moderate (Subject to drip fees) | Moderate (Standardized queues) | Limited (Governed by carrier rules) | Multi-product bundling (Flight + Hotel) |
| Opaque Sellers | Wholesale Margin Spread | Low (Details hidden pre-pay) | Low to Moderate | Extremely Low (Strictly final) | Flexible solo travel with set schedules |
| Direct Suppliers | Direct Retail Margin | High (Clear fare family tiers) | High (Direct control of PNR) | High (Priority rebooking queue) | Point-to-point travel; loyalty members |
| Algorithmic Generators | Booking Fees & Add-On Insurance | Moderate (Hidden risk factors) | Low (Automated/Paid tiers) | Conditional (Requires paid shield) | Complex multi-leg budget itineraries |
| Wholesale Portals | Membership Subscriptions | High (Displays net rates) | High (Dedicated call queues) | Moderate to High | Premium hotel stays; business travel |
Detailed Real-World Scenarios
To demonstrate how platform mechanics function during travel disruptions, consider four realistic scenarios that illustrate the constraints, decision points, and second-order failure modes inherent in third-party bookings.
The Self-Transfer Transatlantic Connection
-
Scenario Context: A budget-conscious traveler books a flight from Chicago (ORD) to Prague (PRG) discovered via a metasearch site. To save $180 compared to a main-line carrier ticket, the traveler buys a split-ticket itinerary through a secondary online broker. The trip requires changing planes at London Gatwick (LGW), transferring between two non-partner budget airlines with a 1-hour and 40-minute layover.
-
Constraints & Variables: Tight layover window; carry-on luggage only; no interline ticketing agreement between operating carriers.
-
Operational Failure Mode: The inbound transatlantic flight suffers a 50-minute runway delay in Chicago due to de-icing procedures. The flight lands at Gatwick with only 50 minutes remaining before the connecting flight’s departure. The traveler must exit border control, re-clear airport security, and reach the departure gate. The gate closes 15 minutes before departure, causing the traveler to miss the second flight.
-
Second-Order Effects: Because the ticket was issued as two independent bookings through a secondary broker, the second airline logs the traveler as a no-show, automatically canceling their return flight segment without a refund. When the traveler calls the online broker’s customer support line, they are routed to an automated queue with a 24-hour turnaround time.
-
Financial Outcome: The traveler is forced to purchase a walk-up, single-leg replacement ticket at the Gatwick counter for $420 to reach Prague, plus an additional $280 to replace the canceled return leg. The initial $180 savings yields a net financial loss of $520, alongside a 12-hour airport delay.
Peak-Season Hotel Inventory Overbooking
-
Scenario Context: A couple reserves a seven-night stay at a boutique oceanfront property in Miami during peak winter holidays. A third-party discount booking site lists the room at $195 per night, whereas the hotel’s direct portal lists the identical room category at $235 per night.
-
Constraints & Variables: High-demand holiday period; non-negotiable travel dates; fully booked regional hotel capacity.
-
Operational Failure Mode: The third-party booking engine transmits reservations to the hotel’s Property Management System (PMS) via asynchronous, batch-processed EDI files rather than an instant API integration. During the four-hour delay between booking and file transmission, the hotel sells its final physical room directly through its official website. Upon check-in, the front desk discovers an overbooked status.
-
Second-Order Effects: Property management applies standard hospitality walk protocols: guests who booked directly with the hotel retain their rooms, while third-party OTA reservations are selected for relocation. The hotel transfers the couple to a secondary partner property located three miles inland. Furthermore, a mandatory $45-per-night resort fee, which was omitted from the discount site’s initial summary display, is charged at check-in.
-
Financial Outcome: The expected savings of $280 across the seven-night stay ($40 per night) are wiped out by $315 in unquoted resort fees, resulting in a net loss of $35 and a downgraded location far from the beach.
Schedule Modifications on Restricted Business Itineraries
-
Scenario Context: A corporate consultant needs to fly between San Francisco (SFO) and Austin (AUS) for a client presentation. To reduce expenses, the traveler selects a basic economy fare offered by a secondary OTA for $160, compared to a $230 main cabin flexible fare on the direct airline site.
-
Constraints & Variables: Volatile meeting schedule; tight arrival timeline; high likelihood of meeting time adjustments.
-
Operational Decision Point: The client shifts the presentation start time forward by four hours, requiring the consultant to move to an earlier morning flight.
-
Operational Failure Mode: The consultant attempts to modify the flight through the secondary OTA’s mobile app. However, the basic economy fare class selected explicitly forbids schedule changes under airline tariff rules. Additionally, the OTA charges a $40 administrative fee simply to submit an exception request to the carrier.
-
Second-Order Effects: The carrier declines the exception request, citing third-party ticket ownership and strict fare family restrictions. The secondary OTA refuses to issue a credit or refund for the unused ticket.
-
Financial Outcome: The consultant must abandon the original $160 basic economy ticket completely and purchase a new, same-day walk-up ticket directly from the carrier for $380. Total expenditure reaches $540, whereas purchasing the original $230 flexible direct fare would have allowed a free same-day change.
Cross-Border Rental Car Hidden Surcharges
-
Scenario Context: A driver plans a 10-day road trip across Western Europe, booking a rental car through a budget comparison engine that displays a rate of $18 per day via a regional car rental agency.
-
Constraints & Variables: International border crossings (France to Italy); driver using personal credit card for collision damage coverage; strict travel budget.
-
Operational Failure Mode: Upon arriving at the rental counter in Nice, the driver learns that the $18 daily rate excludes two mandatory local line items: an international cross-border permit fee ($15 per day) and a mandatory local location surcharge ($8 per day). Furthermore, the rental agency refuses to accept the driver’s credit card auto-rental insurance unless the driver presents an official, printed letter of coverage from the bank translated into French.
-
Second-Order Effects: Unable to provide the physical coverage letter on short notice, the driver is forced to purchase the agency’s proprietary Collision Damage Waiver (CDW) at the counter for $28 per day to complete the rental.
-
Financial Outcome: The anticipated $180 rental cost inflates at the desk to $690 over the 10 days ($18 base + $15 border fee + $8 location fee + $28 CDW = $69 per day), transforming an apparent budget deal into a costly rental.
Planning, Cost, and Resource Dynamics
Evaluating travel booking platforms requires a deconstruction of the financial models used by intermediaries. What appears to be a transparent purchase often contains hidden fees, currency markups, and long-term opportunity costs.
Direct, Indirect, and Opportunity Cost Vectors
-
Direct Cost Vectors: The baseline, visible cost components of a travel reservation. These include net transport fares, lodging room charges, government security taxes, facility usage fees, and mandatory fuel surcharges.
-
Indirect / Hidden Cost Vectors: Financial additions introduced during checkout or post-transaction processing. Common examples include:
-
Price-Drip Fees: Ancillary line items added sequentially during checkout screens (e.g., seat selection fees, mandatory luggage additions, booking service charges).
-
Payment Processing Surcharges: Fees applied to specific payment cards or international credit card networks.
-
Dynamic Currency Conversion (DCC) Markups: Foreign transaction exchange markups applied by international booking portals. Intermediaries often apply conversion exchange rates that are 3% to 6% higher than mid-market interbank rates.
-
-
Opportunity Cost Vectors: Long-term financial and experiential values sacrificed when booking through unvetted third-party channels. This includes forfeiting carrier loyalty points, losing qualifying spend toward elite tier status, waiving eligibility for complimentary room upgrades, and losing priority handling during bad weather cancellations.
Cost Realization Index Across Platform Archetypes
The table below illustrates how a hypothetical $100 baseline flight fare evolves across different platform types once mandatory surcharges, ancillary additions, and conversion markups are calculated.
| Cost Line Item | Metasearch Redirect (Direct Airline Book) | Tier-1 Global OTA | Secondary / Regional OTA | Direct Supplier Portal |
| Initial Quoted Base Rate | $100.00 | $100.00 | $88.00 | $100.00 |
| Mandatory Taxes & Fees | Standard Government ($15) | Standard Government ($15) | Standard + Processing ($22) | Standard Government ($15) |
| Seat & Baggage Unbundling | Included or Optional ($0–$30) | Optional ($25) | High Mandatory Surcharge ($35) | Included or Optional ($0–$30) |
| Payment / Conversion Fee | $0.00 (Local Currency) | $0.00–$3.00 | $5.00–$12.00 (DCC Surcharge) | $0.00 (Local Currency) |
| Post-Booking Administrative Fee | $0.00 | $0.00 | $25.00 (Platform Modify Fee) | $0.00 |
| Loyalty & Point Accrual Equity | -$8.00 (Value Earned) | -$2.00 (OTA Points) | $0.00 (Forfeited) | -$8.00 (Value Earned) |
| Realized Net Cost Range | $107.00 – $137.00 | $138.00 – $141.00 | $180.00 – $182.00 | $107.00 – $137.00 |
Tools, Strategies, and Support Systems
Systematically finding genuine budget travel deals requires pairing digital search tools with disciplined booking habits. Relying on a single site or search engine exposes travelers to dynamic pricing practices and incomplete inventory views.
Key Tactical Implementations and Technical Strategy
-
GDS-Level Fare Matrix Tools: Utilizing advanced fare search engines (such as matrix search tools powered by software like ITA Matrix) to analyze raw fare codes, routing rules, and historical pricing trends without tracking cookies or affiliate biases.
-
Multi-Engine Parallel Searches: Running simultaneous searches across aggregators backed by different GDS systems (for example, pairing Google Flights for global carrier inventory with Skyscanner for regional low-cost carriers).
-
Fare-Family Audit Protocols: Carefully checking fare-family conditions (e.g., Basic Economy vs. Main Cabin) on the direct airline site before completing a purchase through a third-party OTA, ensuring carry-on bags and seat selection rights are included.
-
Virtual Payment Cards and Price Controls: Using single-use or capped virtual credit cards when purchasing tickets from unfamiliar online travel brokers to block unauthorized recurring charges or hidden post-booking adjustments.
-
Localized Domain Searches (Geo-Arbitrage): Checking prices on regional domain extensions (e.g.,
.co.uk,.fr,.es) or setting regional point-of-sale settings to spot localized currency pricing differences, while staying compliant with platform terms. -
Card-Linked Travel Portal Utilization: Booking through primary credit card portals to redeem points or use annual travel credits, while verifying that the underlying ticket receives card-level delay and cancellation insurance.
-
Direct Property Matching Requests: Contacting boutique hotels directly with an OTA price quote in hand. Property managers will often match or beat a third-party rate by 5% to 10% to avoid paying 15% to 25% OTA commissions.
Risk Landscape and Failure Modes
Purchasing travel through price comparison portals involves managing operational, technical, and legal risks. Understanding these failure points helps travelers protect their itineraries against unexpected disruptions.
Failure Mode Taxonomy Matrix
| Failure Mode | Underlying Root Cause | Operational Severity | Primary Failure Impact | Structural Mitigation Strategy |
| Unissued Ticket Gap | OTA collects payment but delays issuing wholesale bulk ticket numbers. | Critical | Traveler arrives at airport without an active airline PNR or ticket number. | Demand a 13-digit e-ticket number within 2 hours of payment confirmation. |
| Intermediary Insolvency | Secondary travel broker files for bankruptcy while holding customer funds. | High | Complete loss of booking value; tickets canceled by suppliers for non-payment. | Pay exclusively via primary credit cards with chargeback protections. |
| Omitted Property Surcharges | Aggregators hide locally collected resort fees to display an artificially low rate. | Moderate | Unexpected mandatory cash/card charges at hotel check-in desk. | Review full property fee disclosures on the hotel’s official website before booking. |
| Unprotected Split-Ticket Lag | Aggregator links non-partner airlines on separate tickets without interline protections. | Critical | A missed connection voids subsequent flight legs without carrier rebooking. | Maintain layovers of at least 3 to 4 hours between split tickets, or buy travel shield plans. |
| Dynamic Currency Conversion Loss | Booking portal uses marked-up exchange rates during credit card checkout. | Low to Moderate | Hidden 3% to 6% transaction surcharge added to final bill. | Always choose to settle payments in the destination’s native base currency. |
Governance, Maintenance, and Long-Term Adaptation
To manage travel procurement reliably over time, whether for personal travel, family planning, or corporate team management, ad-hoc searching should be replaced with clear booking rules.
Layered Pre-Booking Governance Checklist
Initial Discovery & Price Verification
-
Has the itinerary been checked across at least two distinct metasearch engines?
-
Is the displayed price fully inclusive of mandatory taxes, fuel charges, and facility fees?
-
Has the direct carrier or hotel website been checked to see if price-matching or loyalty-member rates exist?
Intermediary Auditing & Risk Assessment
-
Is the booking entity a direct supplier, a Tier-1 global OTA, or a secondary online broker?
-
If using an unfamiliar online broker, have customer review profiles and business accreditation records been verified?
-
Does the platform issue direct airline PNR codes and e-ticket numbers immediately upon checkout?
Policy, Terms, and Fare Family Audit
-
What are the exact cancellation, refund, and schedule change rules governing this specific fare tier?
-
Are carry-on bags, checked luggage allowances, and seat assignments included in the base price?
-
If flights are delayed or canceled, who holds primary responsibility for rebooking: the airline or the booking site?
Payment Optimization & Records Management
-
Is payment being settled in the merchant’s local base currency to avoid dynamic conversion markups?
-
Is the purchase processed using a credit card that offers primary trip delay, interruption, and cancellation insurance?
-
Have offline copies of booking confirmations, e-ticket numbers, and hotel policies been saved to a mobile device?
Measurement, Tracking, and Evaluation
Evaluating travel site performance requires tracking concrete financial metrics rather than relying on initial search price comparisons.
Key Performance Indicators (KPIs)
-
Search-to-Checkout Price Drift Rate (%):$$\text{Price Drift} = \left( \frac{\text{Final Checkout Price} – \text{Initial Search Price}}{\text{Initial Search Price}} \right) \times 100$$Performance Target: Less than 2%. Higher rates point to poor database caching accuracy or aggressive price-drip practices.
-
Net Realized Savings (NRS):$$\text{NRS} = \text{Direct Supplier Benchmark Price} – (\text{Intermediary Base Price} + \text{Ancillaries Paid} + \text{Resolution Costs})$$A positive NRS confirms that booking through a third party yielded genuine savings after accounting for all added fees and support costs.
-
Disruption Friction Index (DFI): A qualitative score (scaled 1 to 5) measuring support responsiveness, phone wait times, rebooking efficiency, and fee transparency during travel disruptions.
Real-World Travel Log Audit Templates
Direct Carrier vs. Third-Party OTA Reconciliation
-
Search Date: May 12, 2026
-
Target Route: Seattle (SEA) to London Heathrow (LHR)-Roundtrip
-
Target Airline: British Airways
-
Metasearch Quoted Rate: $720 (Discovered via Skyscanner / Listed by secondary broker)
-
Direct Airline Base Rate: $780 (Standard Economy Light)
-
Full Cost Audit: Quoted Base Rate ($720.00) + Payment Processing Fee ($18.00) + Seat Selection Surcharge ($45.00) + Dynamic Currency Markup ($22.00) = $805.00 Final Realized Cost.
-
Direct Differential: -$25.00 (Net financial loss compared to the $780 direct airline booking).
-
Audit Verdict: ABANDON INTERMEDIARY BOOKING. PURCHASE DIRECTLY FROM CARRIER.
High-Yield Intermediary Bundle Realization
-
Search Date: June 4, 2026
-
Target Destination: Cancun, Mexico (5-Night Resort Stay)
-
Booking Channel: Priceline Express Deals (Opaque Model)
-
Direct Retail Benchmark Rate: Hotel ($1,450) + Flight ($420) = $1,870 Total Direct.
-
Full Cost Audit: Opaque Package Base ($1,220.00) + Mandatory Hotel Resort Fee ($200.00) + Airport Ground Transfers ($60.00) = $1,480.00 Final Realized Cost.
-
Direct Differential: +$390.00 (Net realized savings).
-
Risk Assessment: Travel dates locked; non-refundable terms accepted; no itinerary changes needed.
-
Audit Verdict: HIGH-YIELD BOOKING SUCCESSFUL.
Common Misconceptions and Oversimplifications
The travel booking market is full of persistent myths that distort decision-making. Deconstructing these common misconceptions reveals how digital travel distribution actually works.
- Myth 1: “Browsing in Private/Incognito Mode Unlocks Lower Airfares”
- Fact: Dynamic pricing algorithms are driven by complex yield management systems, route demand factors, and real-time fare class availability—not browser cookies. While tracking cookies may trigger targeted marketing ads, broad price changes are caused by global seat inventory updates rather than an individual traveler’s search history.
- Myth 2: “Metasearch Engines Compare Every Travel Website on the Internet”
- Fact: Metasearch platforms index only the websites with which they have active technical connections or commercial affiliate contracts. Major budget airlines frequently block aggregators from scraping their websites, requiring travelers to check those low-cost carriers directly.
- Myth 3: “Online Travel Agencies Always Offer Lower Rates Than Direct Airline Websites”
- Fact: Most major airlines and international hotel chains enforce best-rate policies and offer exclusive member discounts that match or beat third-party prices. In addition, third-party sites frequently add booking or payment fees during checkout that eliminate any upfront price advantage.
- Myth 4: “Airfares Are Always Cheapest When Purchased on Specific Days of the Week”
- Fact: Automated yield-management software adjusts airfares continuously based on real-time demand, historical route patterns, and competitor pricing. Trying to time purchases to specific days of the week is far less effective than monitoring booking windows (e.g., 1 to 3 months before domestic travel, 2 to 5 months for international trips).
- Myth 5: “Add-On Travel Insurance Sold During OTA Checkout Offers Complete Trip Protection”
- Fact: The standard add-on insurance offered during an OTA checkout usually provides limited, basic protection underwritten by high-volume insurance partners. These policies often contain broad exclusion clauses for pre-existing medical conditions, minor weather delays, or schedule adjustments. Independent travel insurance policies usually offer broader coverage for similar costs.
Myth 6: “All Flight Comparison Engines Search the Exact Same Flight Databases”
Fact: Different search engines query different GDS networks, direct NDC feeds, and wholesale consolidator caches. As a result, available route options, split-ticket combinations, and private wholesale fares vary depending on the search engine used.
Ethical, Practical, or Contextual Considerations
Choosing how to book travel involves broader economic, social, and environmental considerations beyond simple price calculations.
Local Economic Impacts and Small Business Sustainability
When a traveler books a room through a major third-party OTA, the platform extracts a commission fee ranging from 15% to 25% from the property owner. While large international hotel chains can easily absorb these distribution costs, independent, family-run boutique inns operate on much narrower margins. Booking directly with local properties ensures that full payment remains with the local business, supporting regional tourism economies while often netting guests better room placements and service.
Environmental Trade-Offs in Budget Route Generation
The push to find the absolute lowest fare often highlights trade-offs between price and carbon efficiency. The cheapest flight itineraries generated by algorithms often involve multi-stop layovers, circuitous connections, or split-carrier transfers. These multi-leg routes burn significantly more fuel per passenger than direct point-to-point flights. Travelers should weigh minor monetary savings against increased carbon footprints and extended travel times.
Cross-Border Legal Jurisdictions and Consumer Protections
Digital travel aggregators operate across international legal borders. A traveler based in North America might purchase a European flight through an online broker registered in an offshore regulatory zone. When travel disruptions occur, determining which consumer protection rules apply (such as EU261 passenger rights or US Department of Transportation refund mandates) becomes difficult. Third-party brokers often pass legal responsibility back to offshore carriers, leaving travelers with limited recourse during travel breakdowns.
Conclusion
Learning to systematically compare budget travel sites requires shifting from passive price-hunting to an active, analytical approach. Modern travel distribution is designed to highlight low initial rates while recovering profit margins through unbundled add-on fees, payment surcharges, and restrictive change terms. Treating initial search display prices as definitive final totals routinely leads to unexpected costs, operational friction, and unmanaged travel disruptions.